This chart has indexed the levels of transations for flats and houses over the last eight quarters. That means it takes the actual level of sales at start of the period and converts them to 100, and then you can see the relative changes running up to the present. It should be noted that the smaller the numbers of properties, the more extreme volatility.
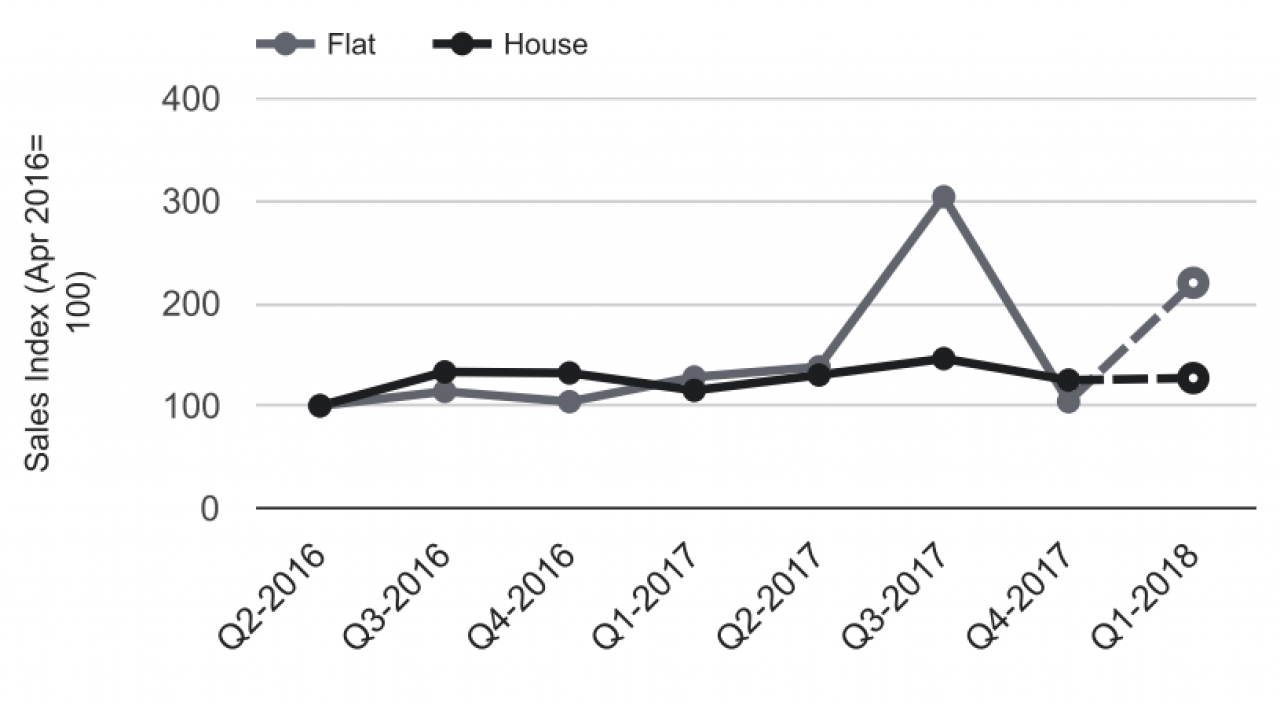
Quarterly index by house type
 By The Protheroe Property Team on 13th Apr 2018,
 By
By 
Share this with
Email
Facebook
Messenger
Twitter
Pinterest
LinkedIn
Copy this link